LTSpice Phasors Analysis
Steady State Analysis - Phasors
Let's enter now the simulation of circuits that involve phasor analysis.
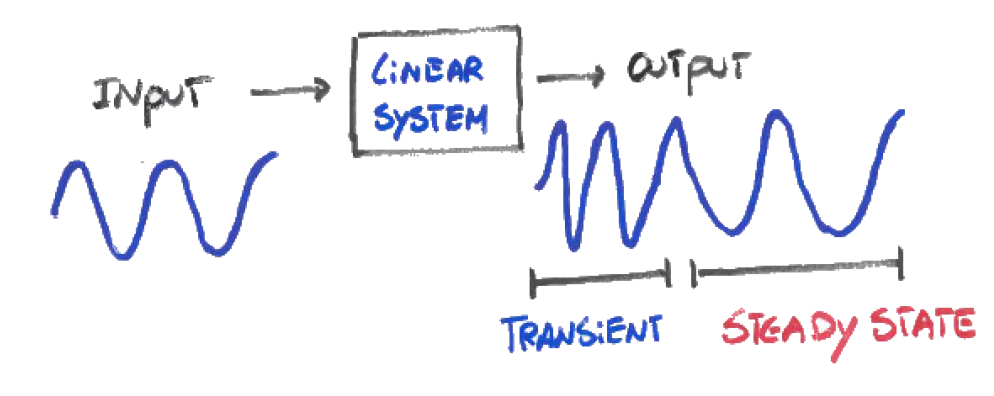
For this particular type of circuits, we are interested in the steady state response when we apply a sinusoidal input (only 1 frequency). That means that in time, we let the transient happen in the circuit, wait a period of time, and then look at the output.
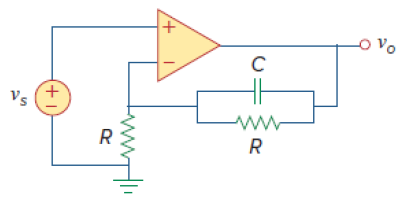
Let's see how can we simulate the following circuit in LTSpice:
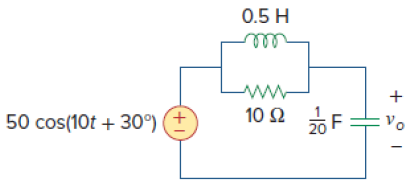
In a typical pen and paper analysis, you would convert all the energy elements (inductors and capacitors) to their respective phasor domain impedance (ZL and ZC) and solve the circuit using the traditional linear circuit methods (e.g.: KVL, KCL, voltage dividers, Thevenin, Norton, Source Transformation, etc).
In LTSpice we can run a Transient analysis or an AC analysis to get the desired phasor output. On the Transient analysis you can check the magnitude and the phase shift of your desired output by looking at the waveforms in time. However, there is a better way to get the final result, and that is by doing an AC analysis on a single frequency.
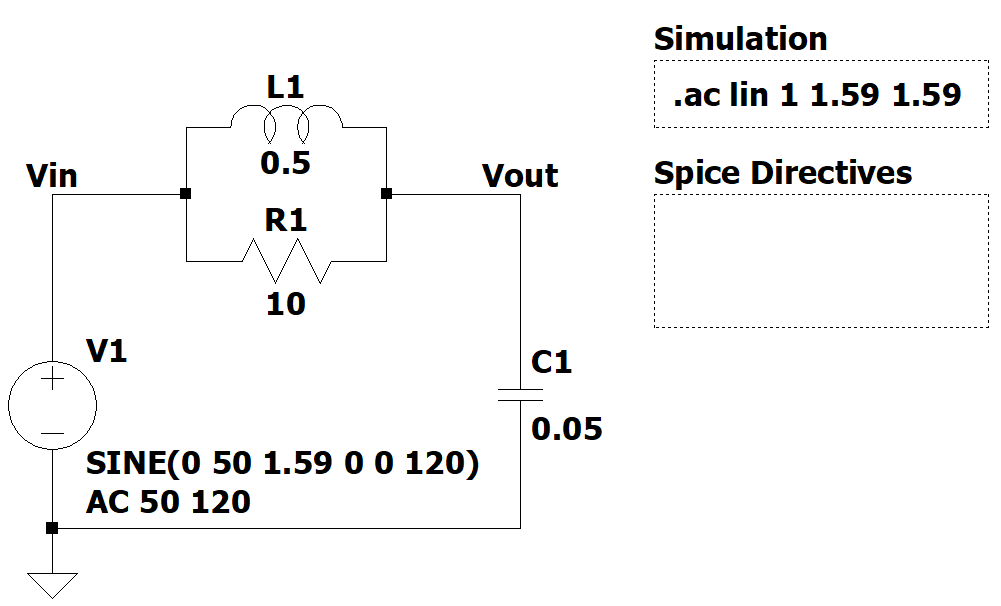
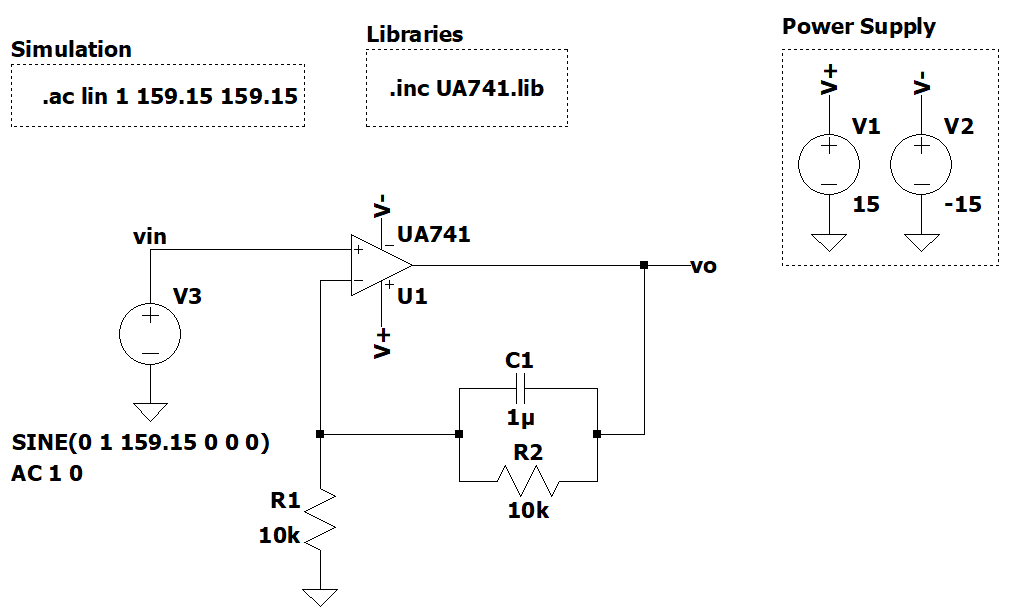
LTSpice circuit
Let's go over the steps one by one and understand the final answer.
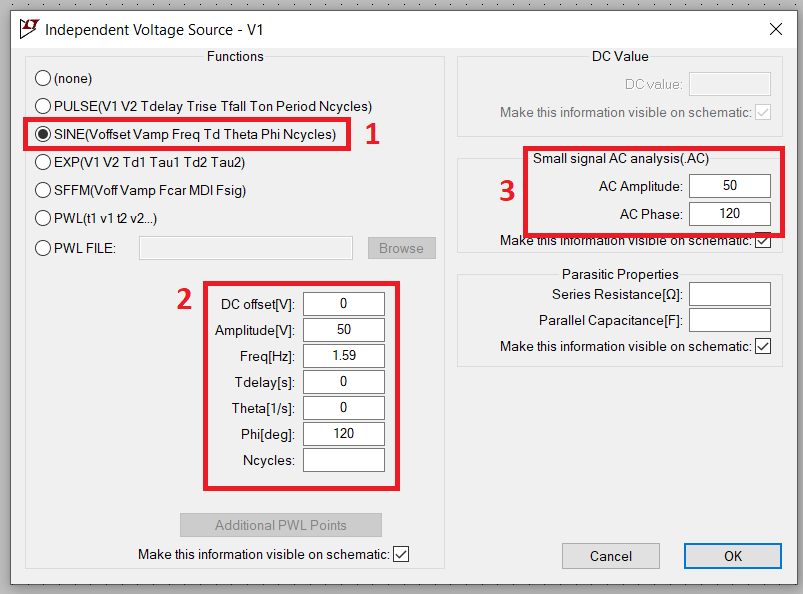
Step 1
- Set voltage source (V1) to a SINE waveform.
- Introduce the parameters for your sinusoidal waveform. In this particular case, convert the angular velocity 10 rad/s to frequency (1.59 Hz), the amplitude stays the same (50 V), and at last you can convert the cos to sin by adding 90 to 30 degrees (120 degrees).
- At last Introduce the same amplitude and phase into the AC analysis parameters section.
Note: If you forget to fill the AC analysis section with the same values as in box 2, your phasor analysis can give incorrect values.
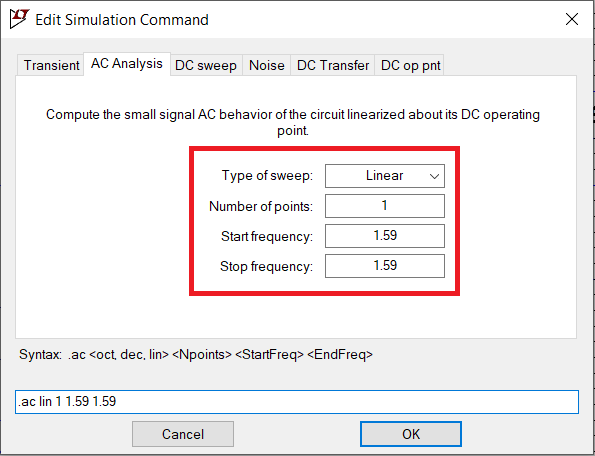
Step 2
- Set the simulation command to run AC analysis.
- We are only interested in analyzing the circuit for one frequency. Set the type of sweep to linear, number of points to 1, and set the start and stop frequency to the frequency of your input (in this case 1.59 Hz).
Step 3
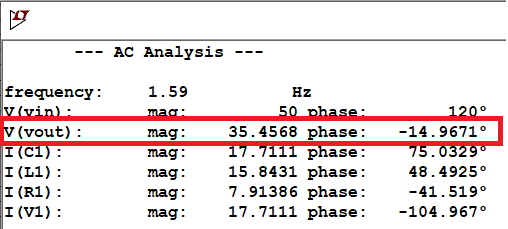
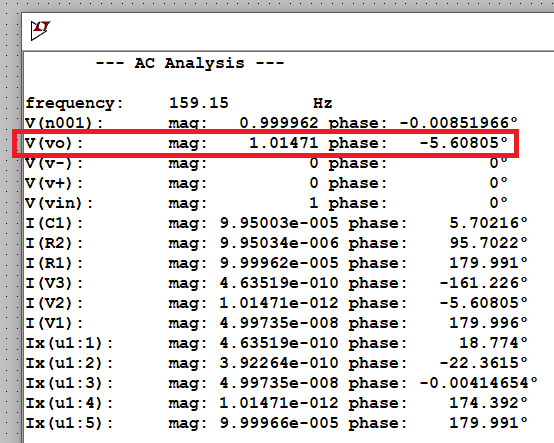
- Run the simulation and check the desired results.
- From Figure 4, remember that the result is related with cosine because we converted the sine to cosine on step 1.
Other Examples

LTSpice Circuit
LTSpice Simulation Files
Spice Components
Directions: Download the spice model and place it in the same project folder that you are working.
References
- None at the moment