ECG Board
ECG Board
✔️ Introduction
The goal with this project is to study and develop a simple electrocardiogram signal conditioning board so students can capture signals generated by the heart and start getting exposed to this type of medical devices.
I want to make clear that developing a professional ECG PCB board is more complex than what is shown in this article. Be careful when connecting a system like this to your body. If you are not comfortable with what you are doing or you don’t have the right equipment to test the system, STOP and don’t connect anything to your body.
This project is divided into 3 phases:
- Phase A: get familiar with what an ECG is. A brief introduction to ECG origins and setting the stage for Phase B.
- Phase B: prototype an ECG signal conditioning system.
- Phase C: build the PCB board for the ECG system tested in Phase B.
✔️ Phase A
Origins
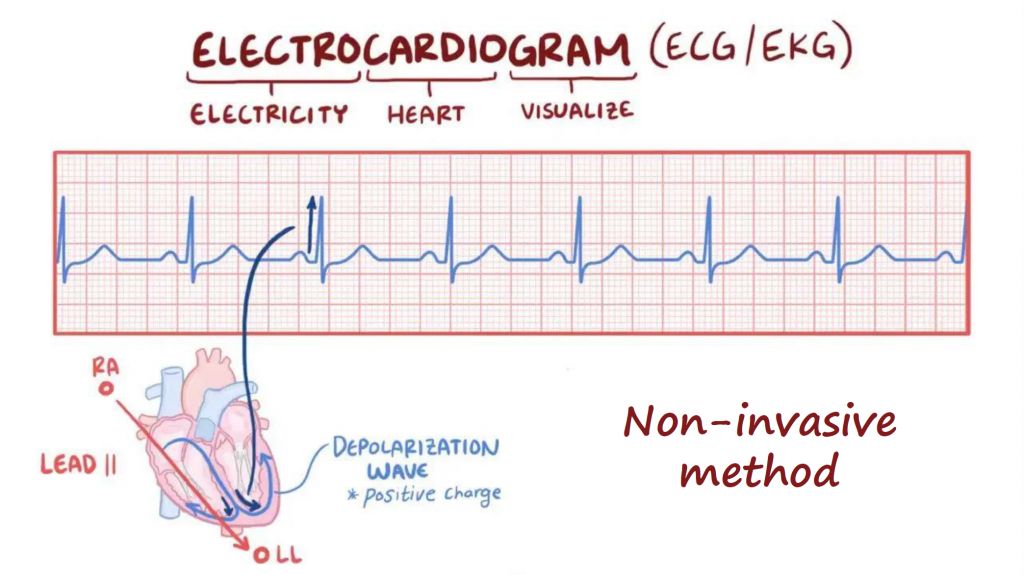
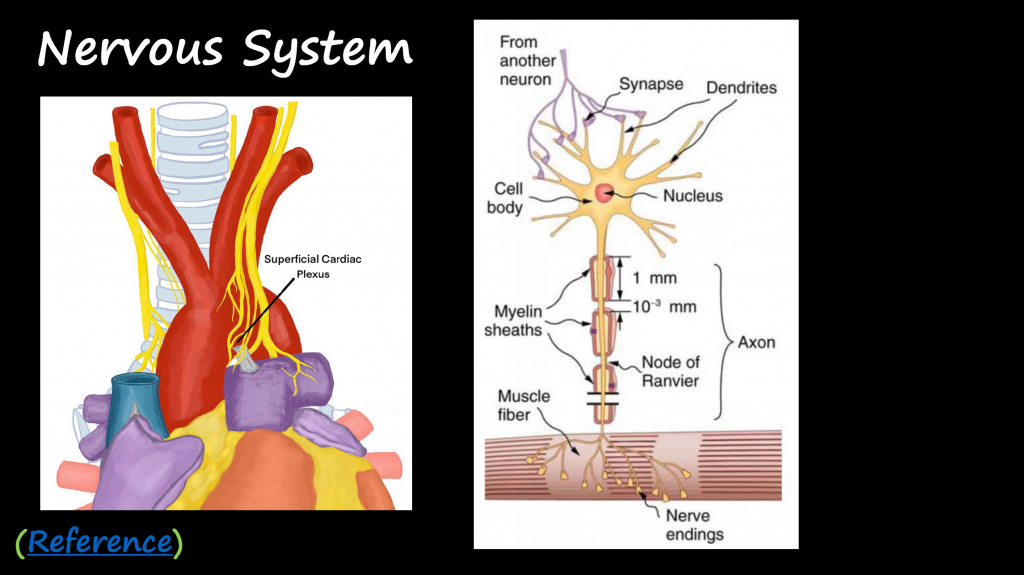
An electrocardiogram is a non-invasive test that records the electrical activity of the heart.
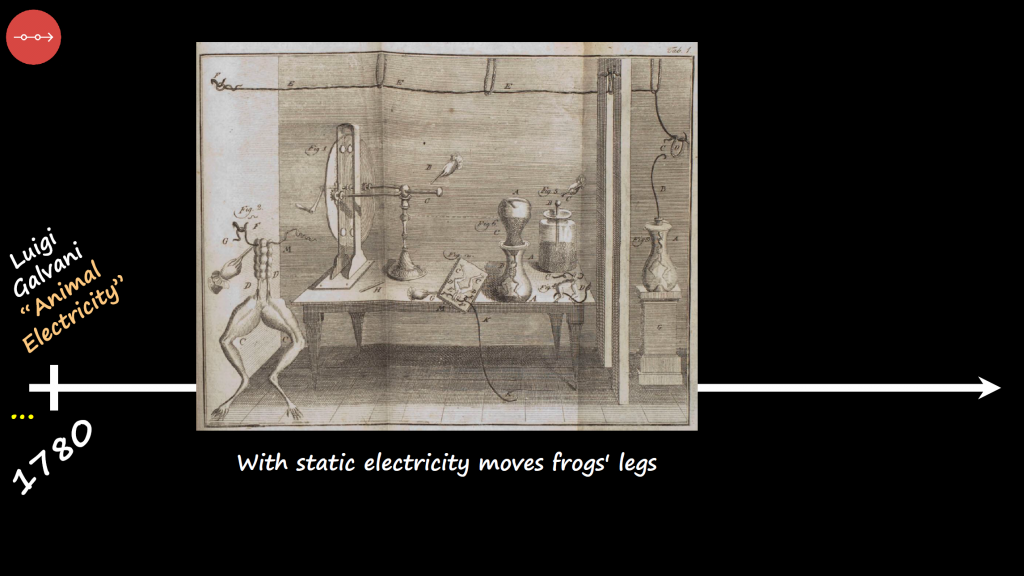
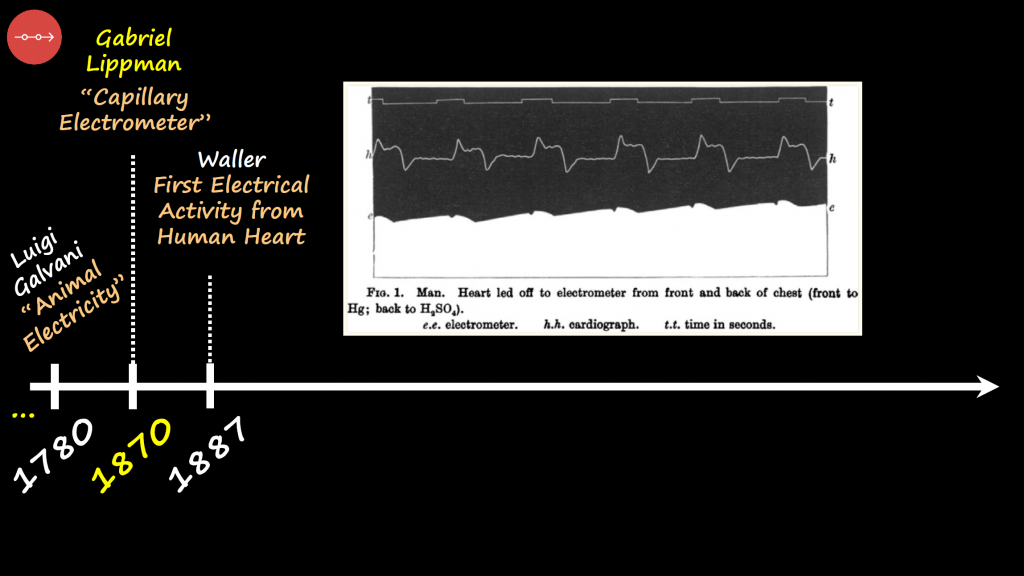
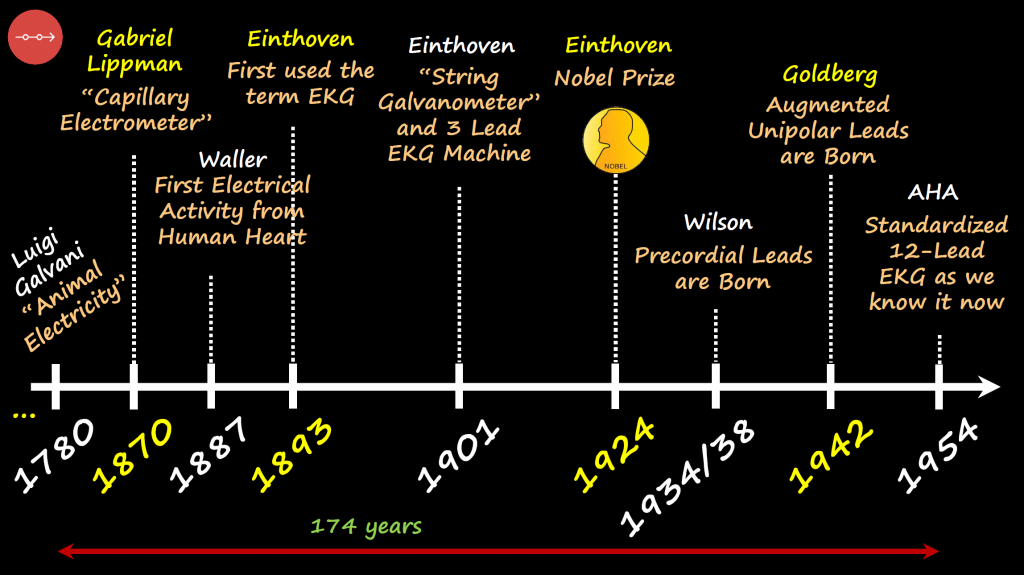
The first encounters of electricity in an animal’s body was discovered by Luigi Galvani with his famous experience with static electricity to move frogs’ legs
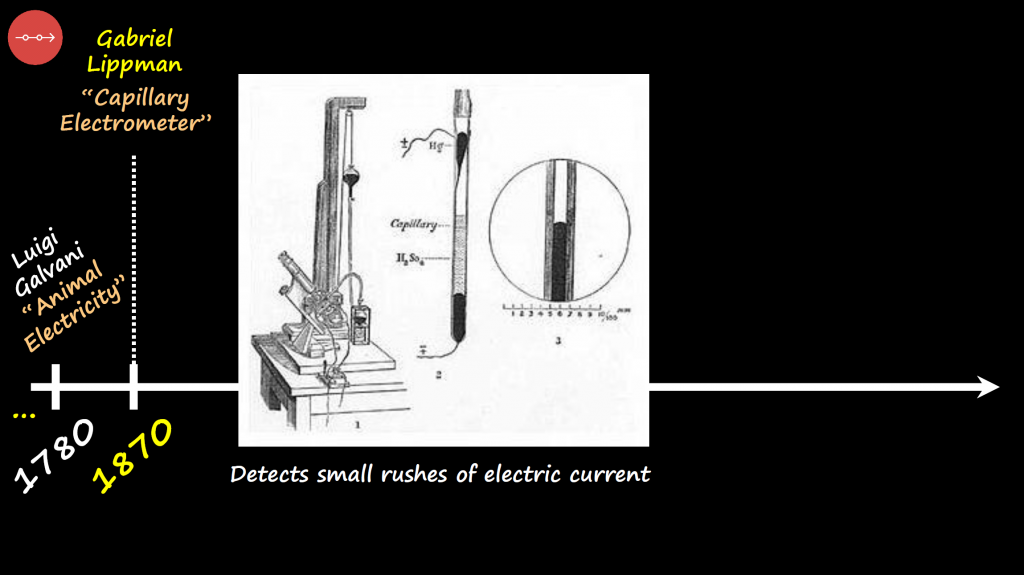
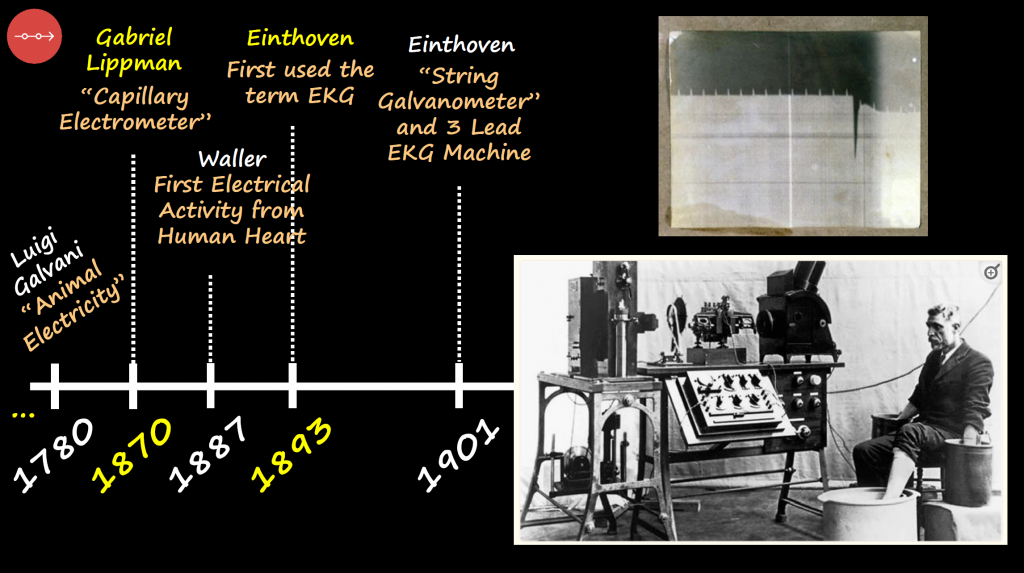
Later, around 1870, Gabriel Lippman developed a capillary electrometer that could detect small rushes of electric current.
And in 1887, Waller recorded the first electrical activity from human heart.
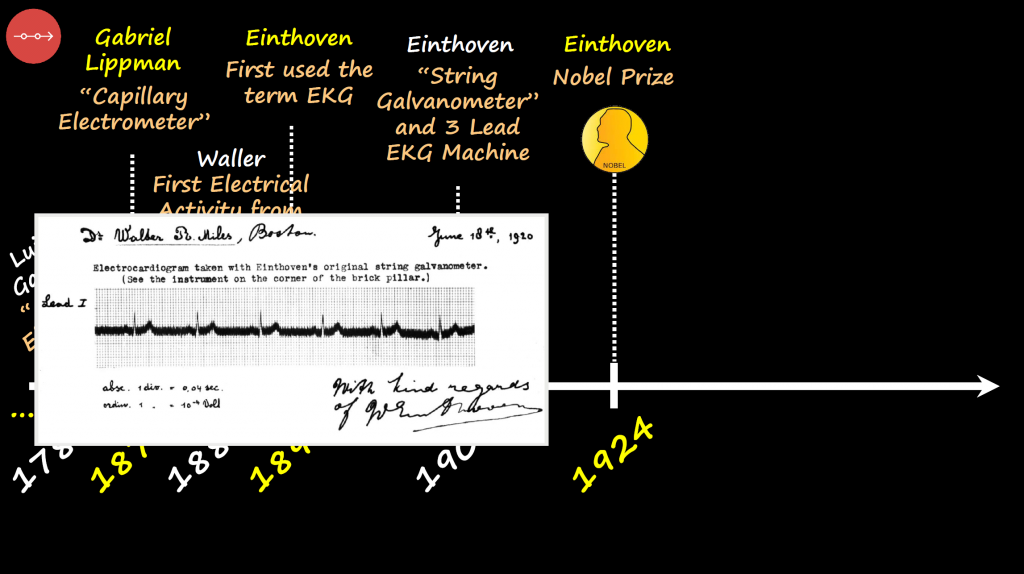
The “String Galvanometer” developed in 1901 by Einthoven push forward the monitoring of electrical signals produced by the heart. This machine used 3 leads to capture the signals.
Giving the Nobel prize in 1924 to Einthoven for his invention. I find it fascinating on how in 1920 the capture of heart signals was already very good.
By 1954 we have the ECG with 12 leads as we know it these days.
This is a very brief introduction of the ECG history and there are for sure other important landmarks in this field. Hope this triggers the curiosity to go and explore more about this subject.
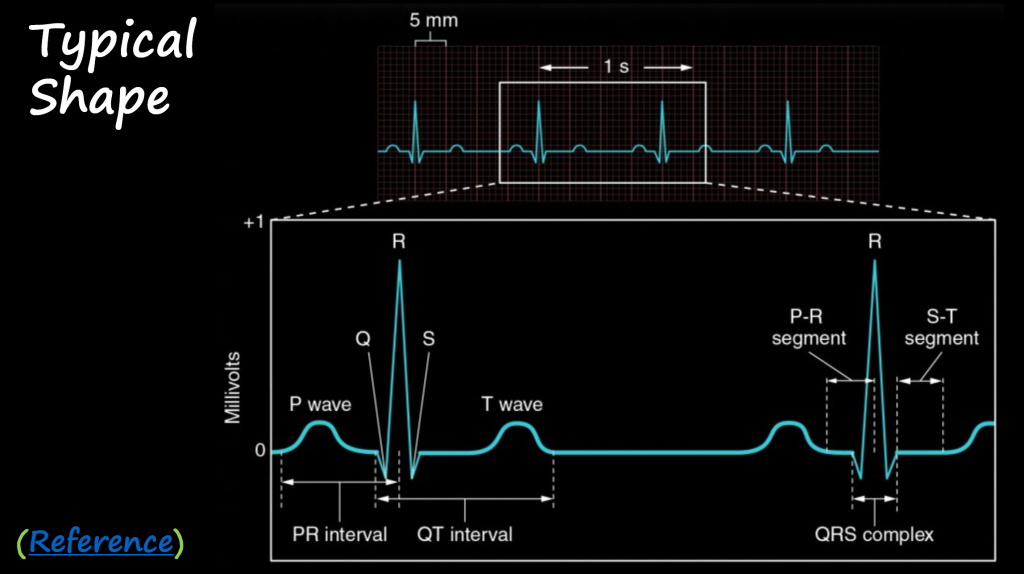
ECG Signal
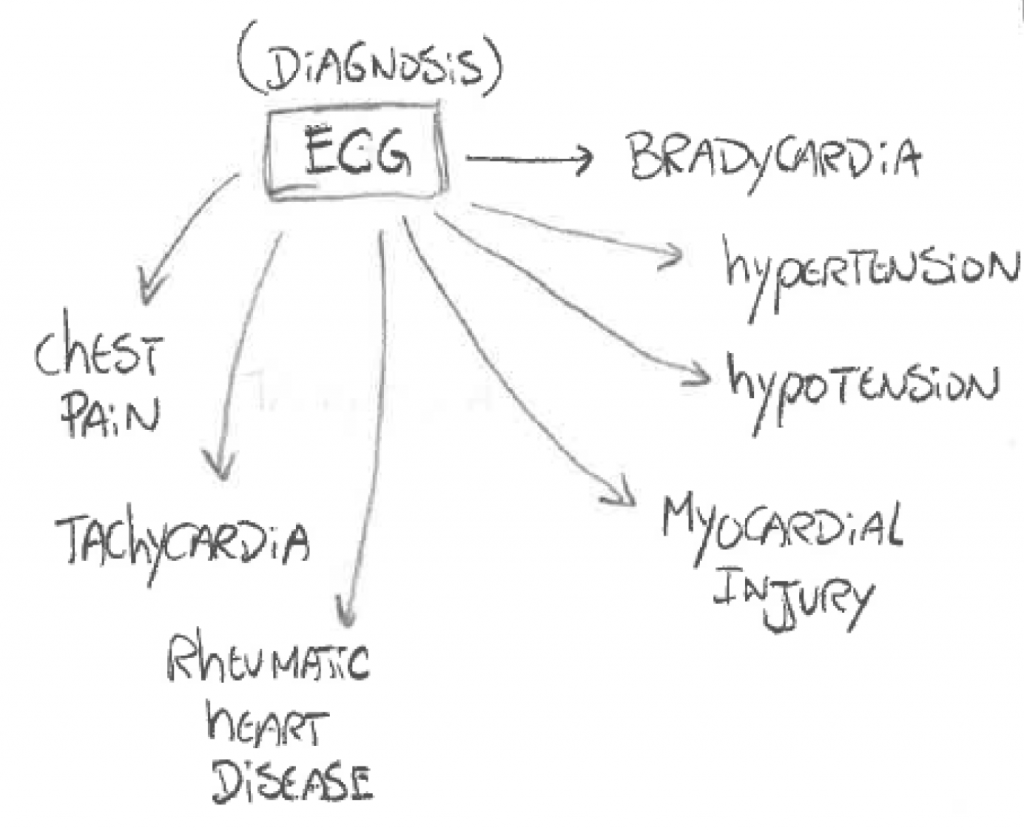
Diagnosis
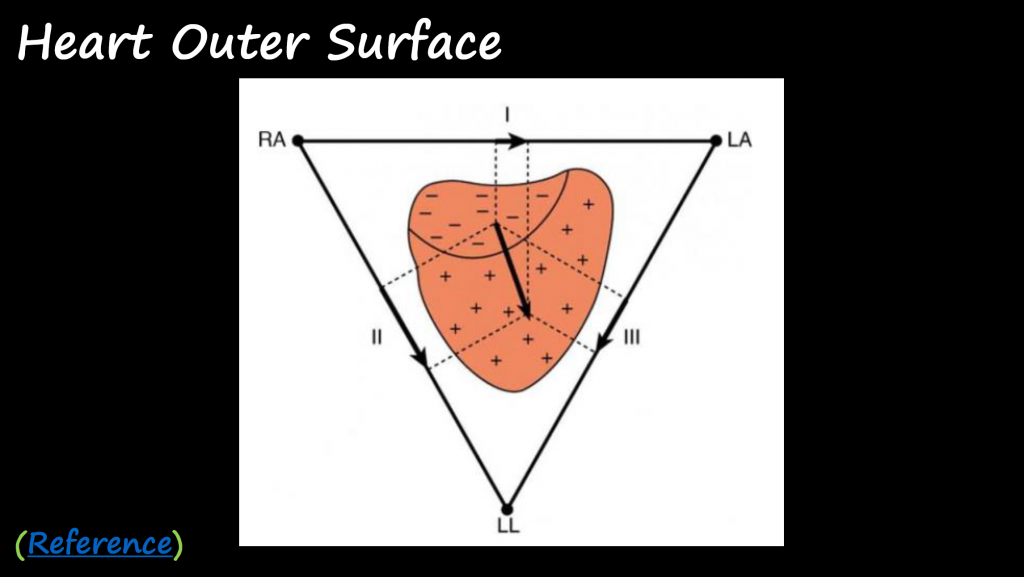
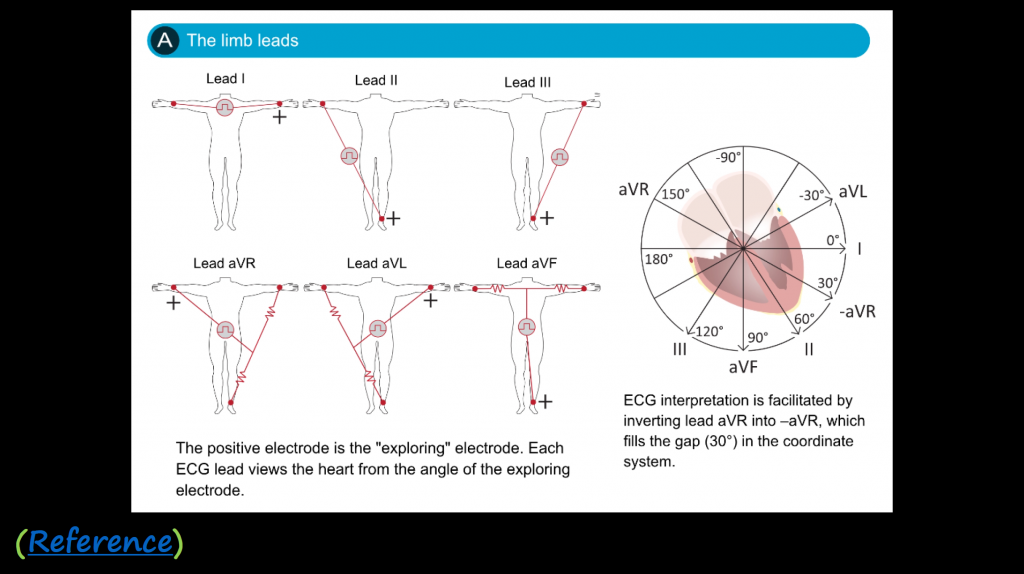
3-Lead ECG
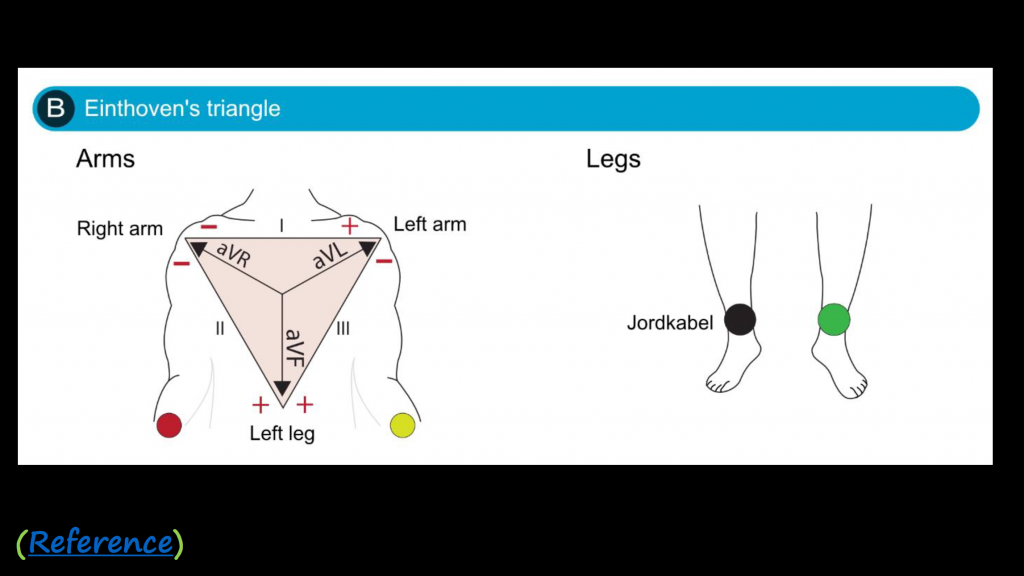
6-Lead ECG
Depending on how we reference the probes among each other, we can capture different views of the heart.
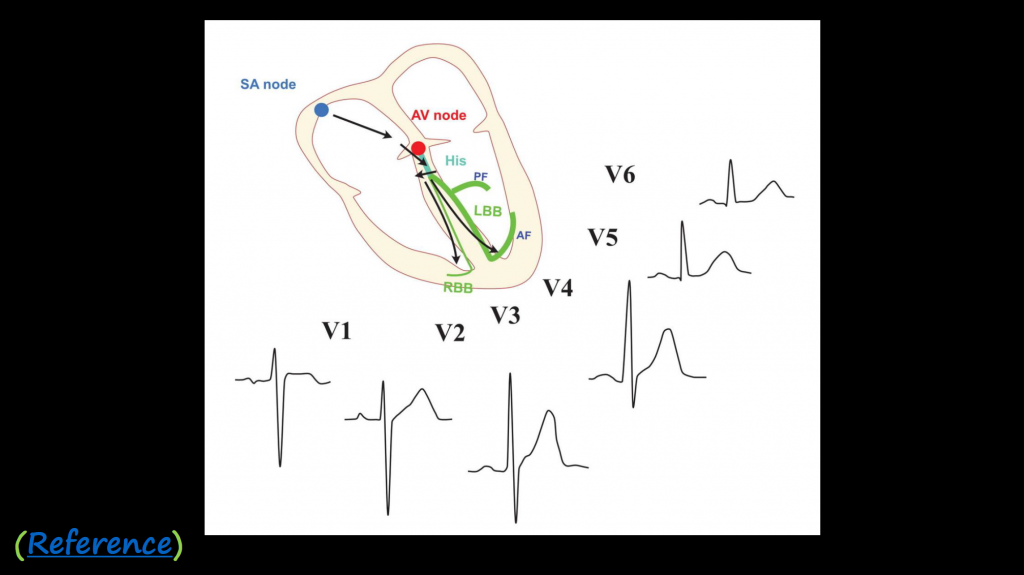
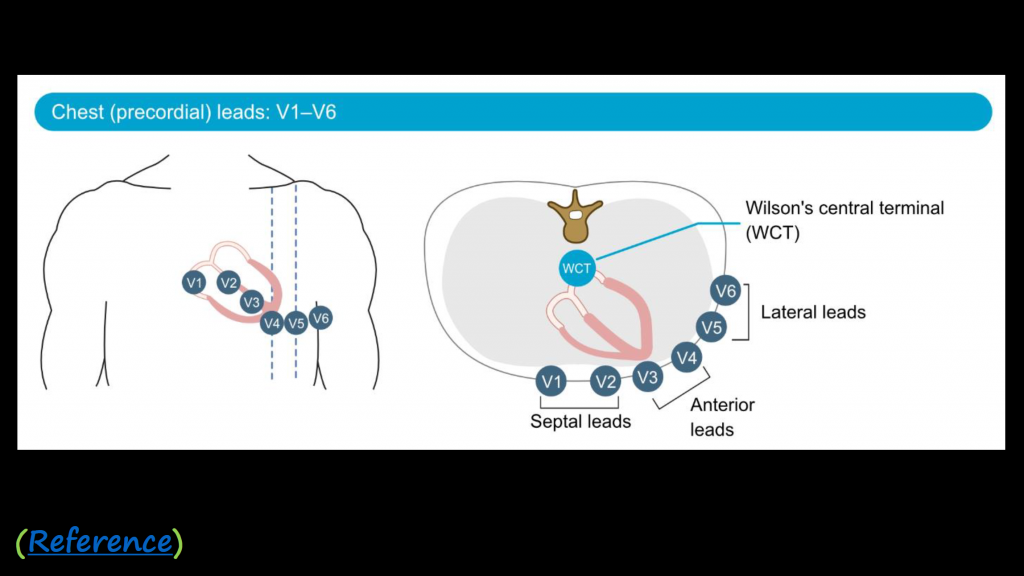
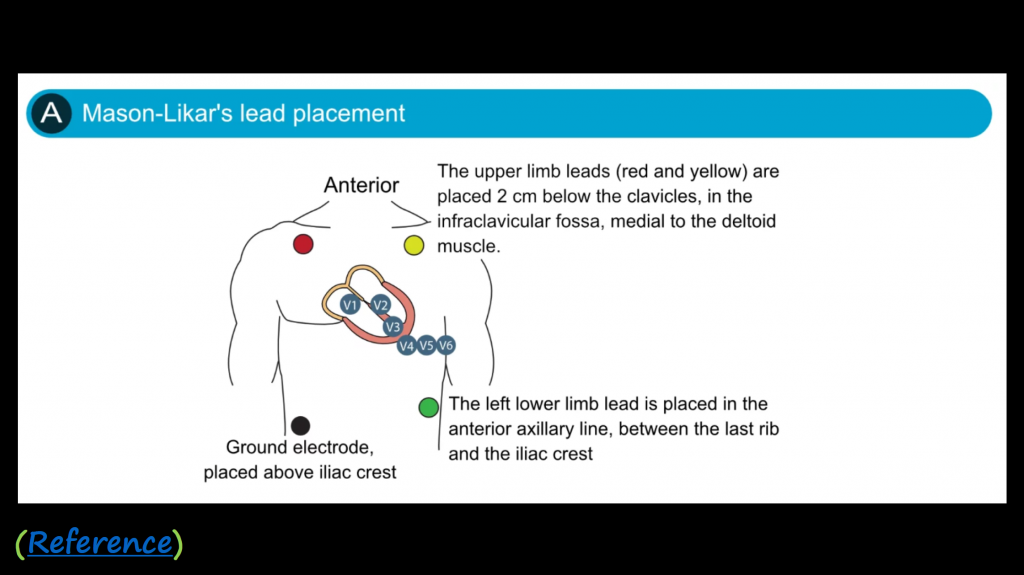
12-Lead ECG
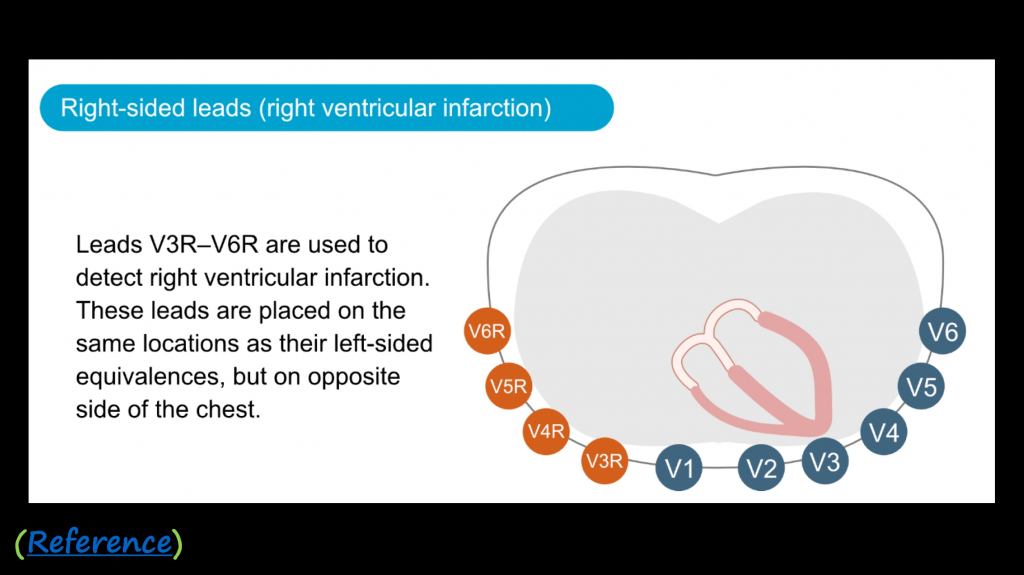
Interesting fact, the 12-Lead ECG uses 10 electrodes to capture 12 different electrical views of the heart. The different views are produced by placing the electrodes at different angles and in relation to the heart’s electrical depolarization.
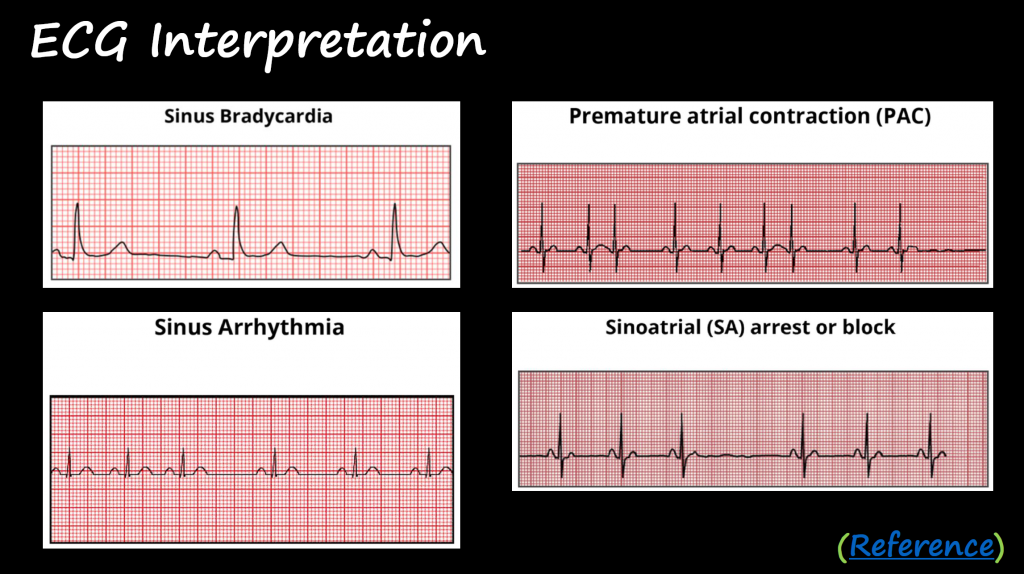
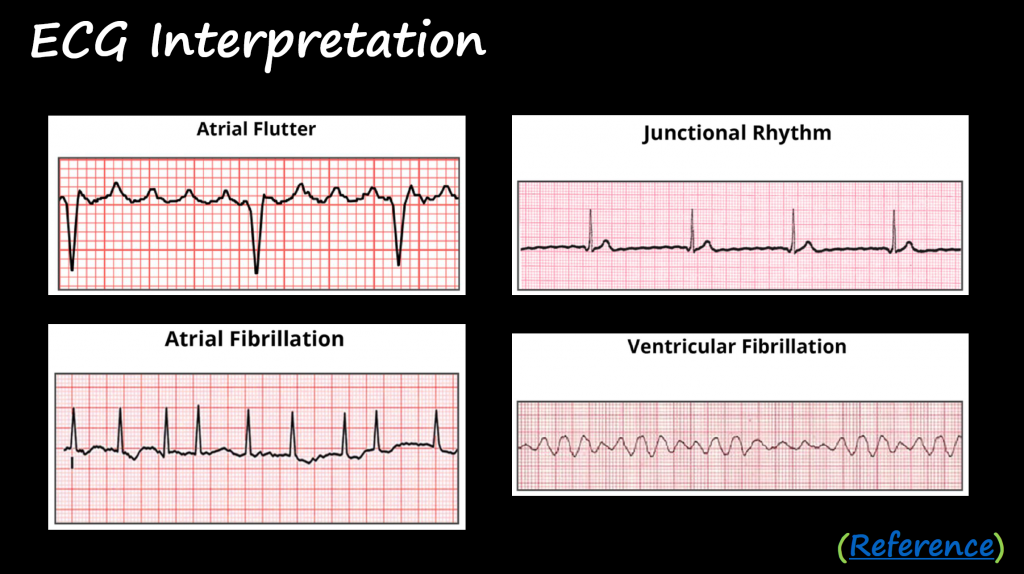
Below you have some examples of heart issues that can be detected with an electrocardiogram.
✔️ Phase B
Reverse Engineering
There are plenty of ECG schematics available online, and it can be overwhelming at first to understand the similarities and differences between all of these designs.

Block diagrams are very helpful to use when reverse engineering schematics. They allow to find similarities between different approaches and they also allow the understanding of the pros and cons of each design. Typically for medical devices, the cost of the system is also important and different approaches are going to have the cost into consideration too.
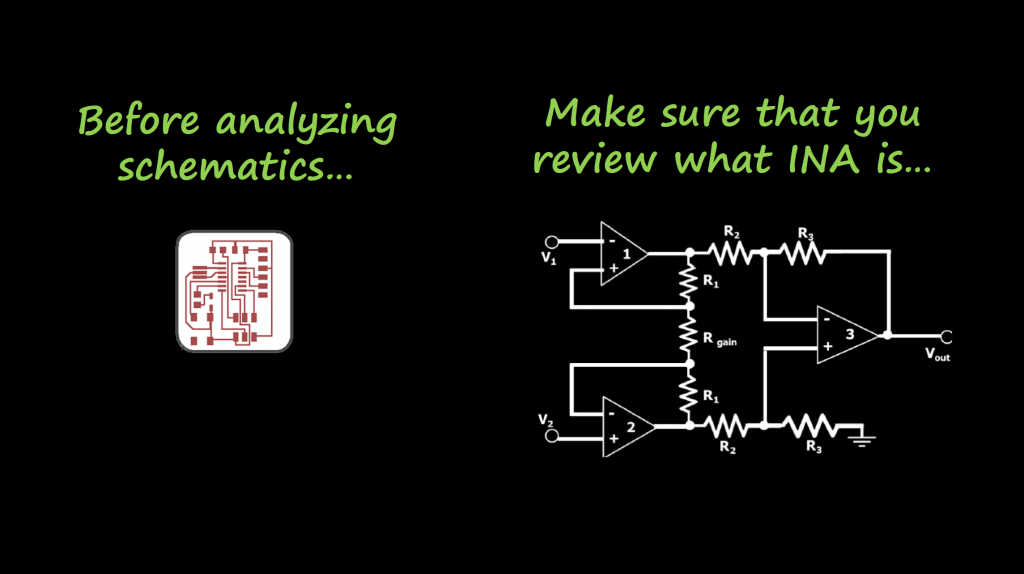
For ECG devices, make sure that you review what an Instrumentation Amplifier (INA) is and how it works. In case you are not familiar, I will cover this subject in a different article.
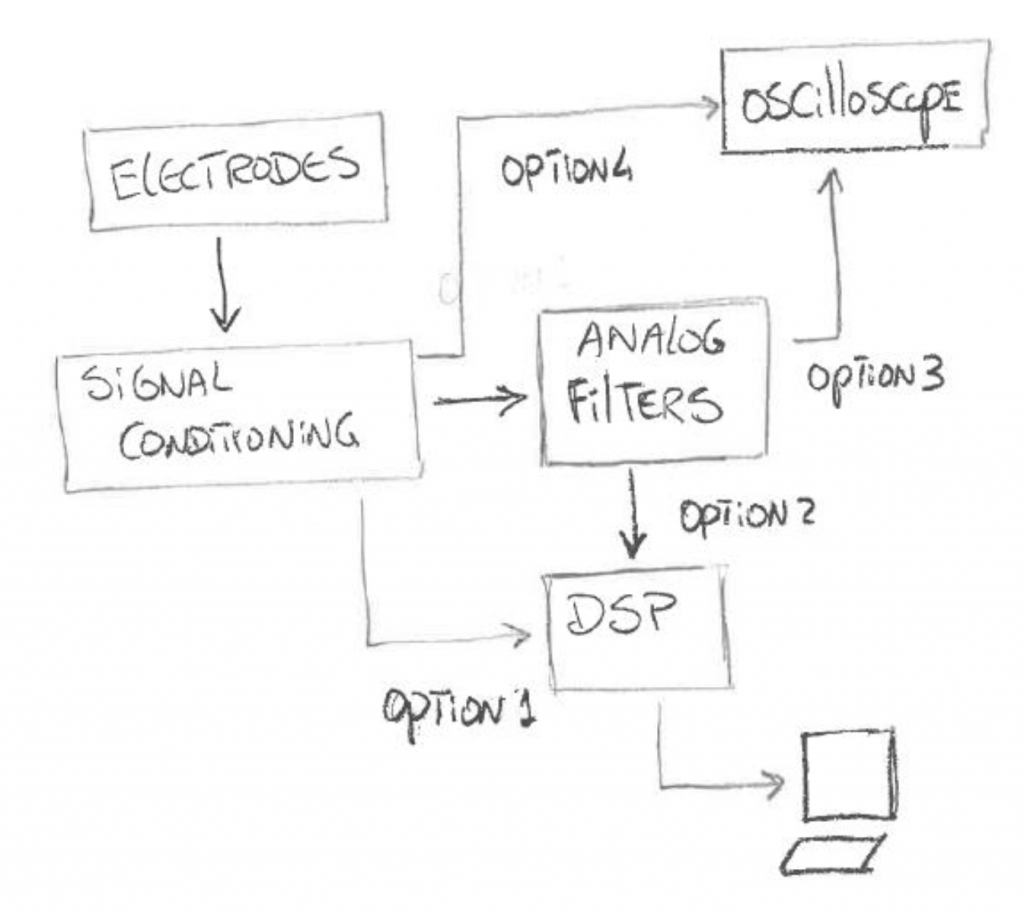
The block diagram below is a general representation of the schematics under the ECG Design References section. There are 4 possible ways to build this system:
- Option 1: after interfacing the probes and amplifying the electrical signals from the heart, with no extra analog filtering, we use an ADC to capture that signal and take the signal to the digital domain to apply DSP algorithms.
- Option 2: in case it is required to filter some noise out to help with the DSP algorithms.
- Option 3: we visualize the signals coming from the INA with some additional analog filtering using an oscilloscope.
- Option 4: we visualize the signals right away from the INA using an oscilloscope.
With this in mind, we are ready to define the project requirements for our ECG system.
Project Requirements
Since this project is not focusing on DSP algorithms, we are going to focus our attention to develop a system that implements Option 3 or 4 from the previous section.
We want to design, simulate and build a 3-Lead ECG signal conditioning system with the following requirements:
Option 4
- Needs to have an INA (Instrumentation Amplifier)
- Visualize the output on an oscilloscope
Option 3
- Include additional filtering if necessary
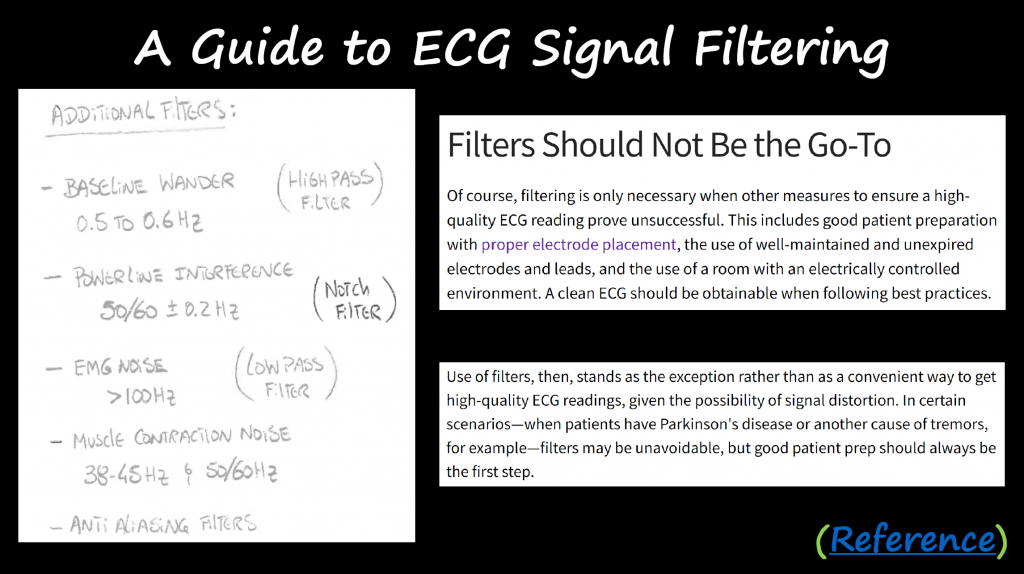
I mentioned additional filtering if necessary, but wat are we filtering?
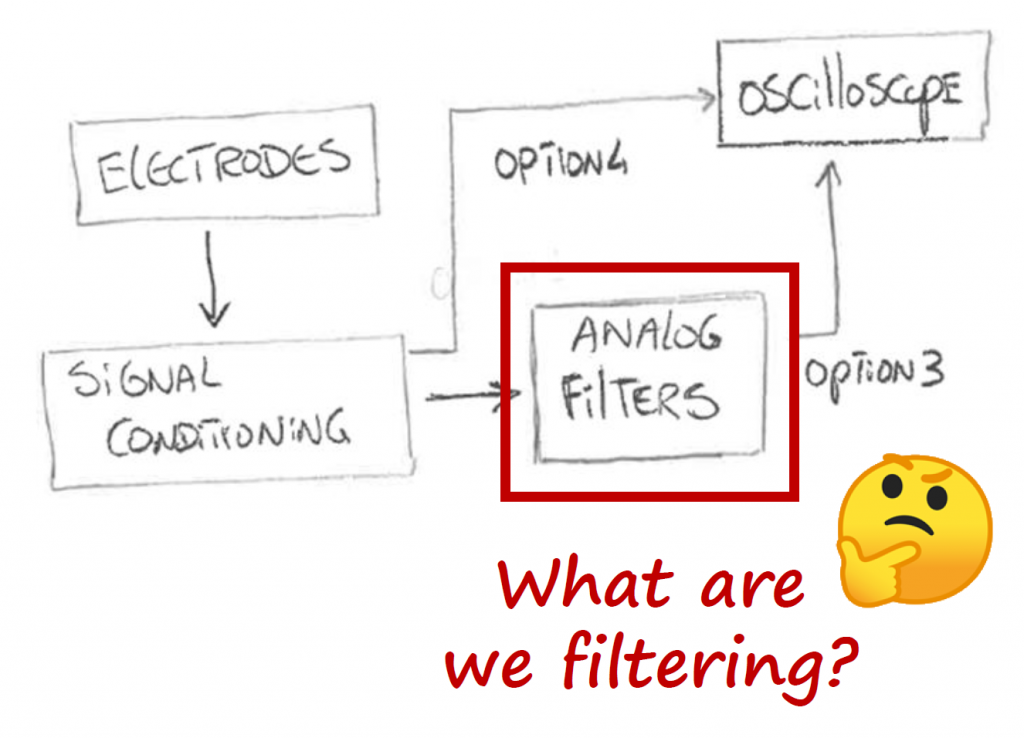
We are filtering a bunch of things such as:
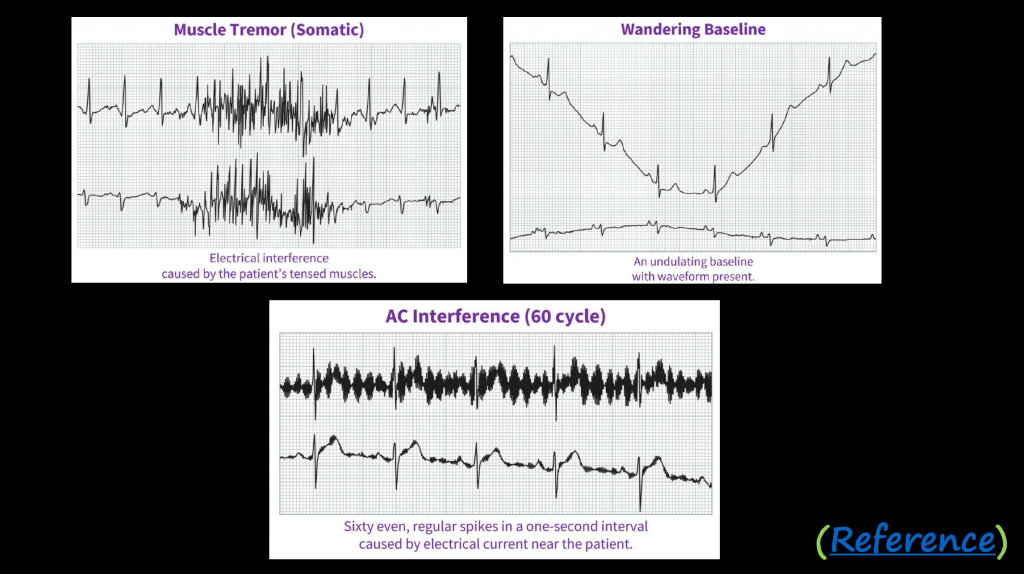
- Baseline wander
- Powerline interference
- EMG noise
- Muscle contraction noise
But remember a golden rule: “Use of filter, then, stands as the exception rather than as a convenient way to get high-quality ECG readings, give the possibility of signal distortion“
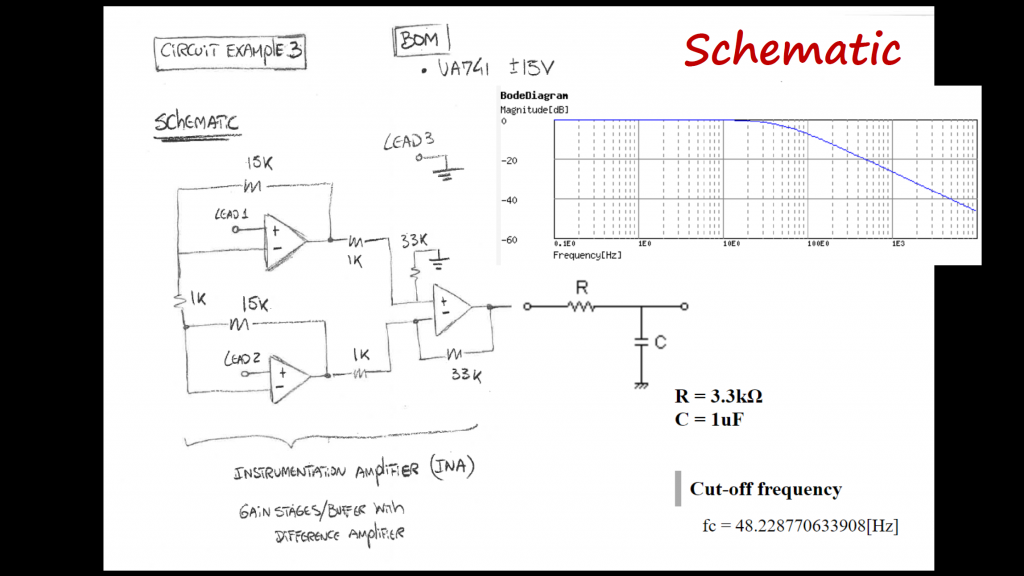
Reference Design
We will be using the following reference schematic:
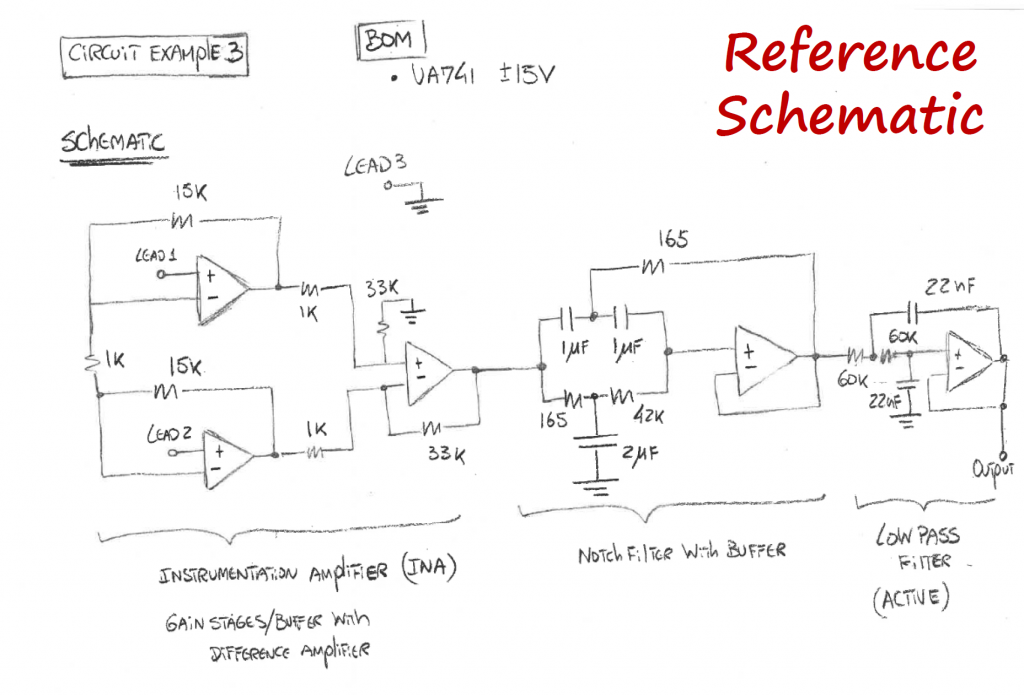
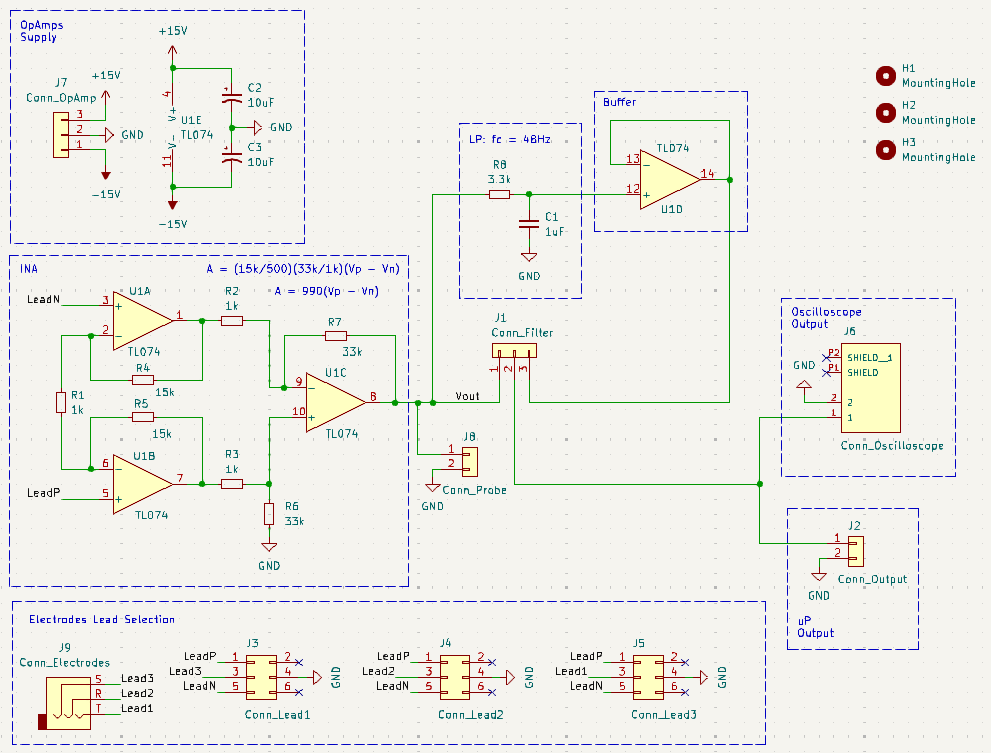
Instead of using a bunch of UA741’s, we will use the TL074 (a low-noise FET-input Op Amp) that has 4 Op Amps inside. This will allow us to minimize the number of wires used to connect the different stages together, minimizing the amount of noise in the circuit.
The values of the resistors are also important. Since signals from the heart are very small (less than 1mV), Johnson noise (thermal noise) can be problematic.
Noise can be viewed as a voltage source 
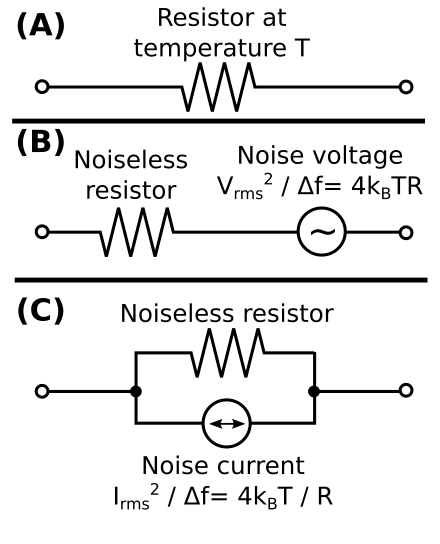
v_n=\sqrt{4 \; k_B \; T \; R \bigtriangleup f}The lower the resistor value is, the lower the voltage noise will be. But if we make those resistor too low, the system will consume more energy. So it will be a balance between energy consumption and minimizing voltage noise.
I will keep the resistors on the lower side of the k’s, keeping the currents in the system under mA.
The two filtering stages after the INA will not be implemented.
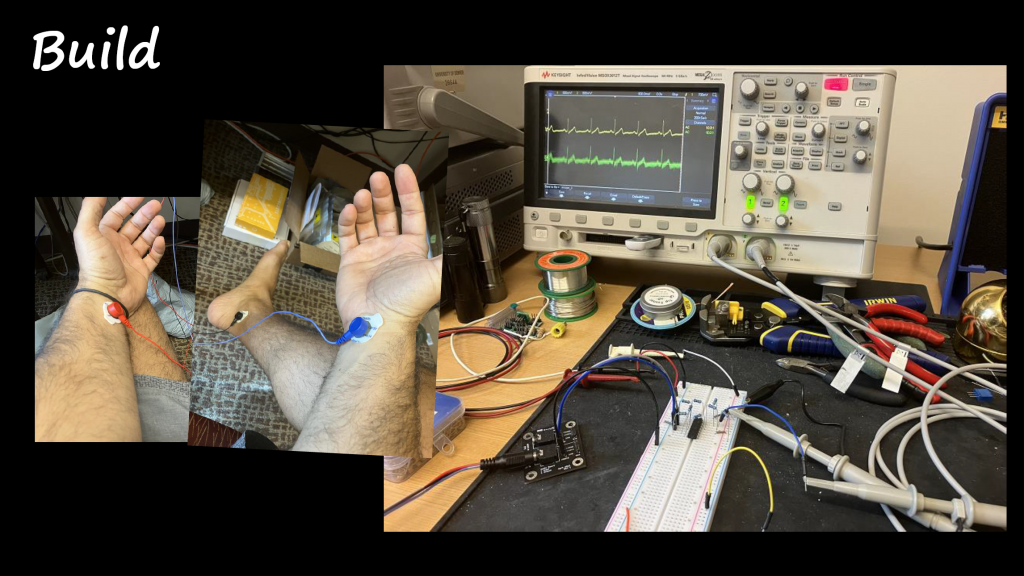
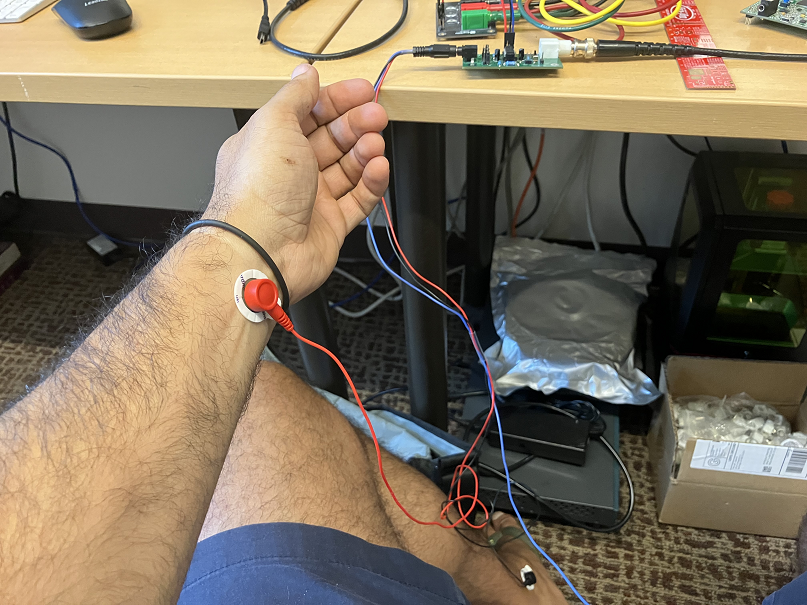
Prototype
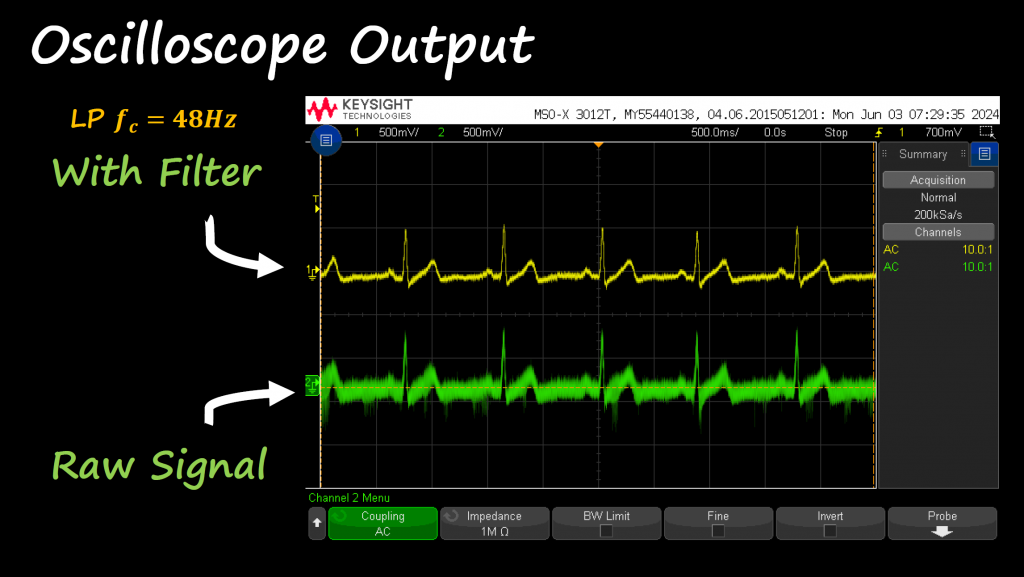
A simple low pass filter was implemented in front of the INA stage just to show how some of the noise could be removed. However, remember that filtering can potentially remove some important signal features.
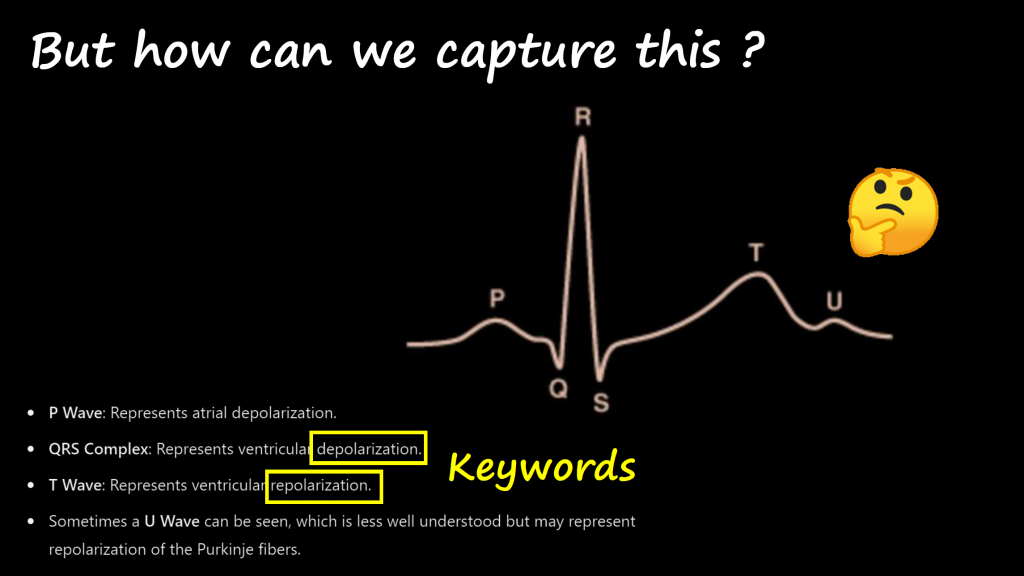
If we focus our attention to capture the P and T waves and the QRS signal, then filtering the signal around 48Hz will be sufficient to detect these waves.
The power supply used to provide power to the Op Amps, was set to output a maximum current of 5mA. If there was a malfunction in the circuit, the power supply will not output more than 5mA, protecting the user.
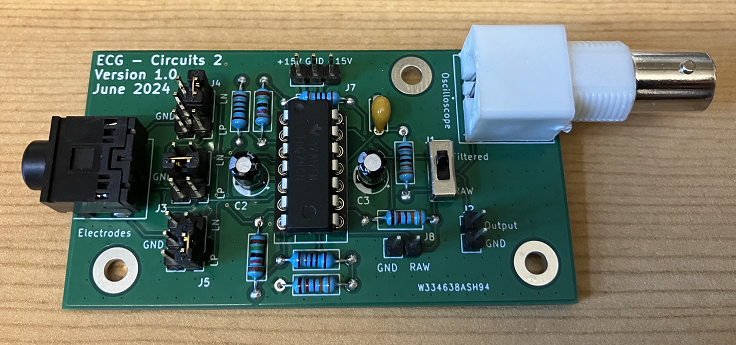
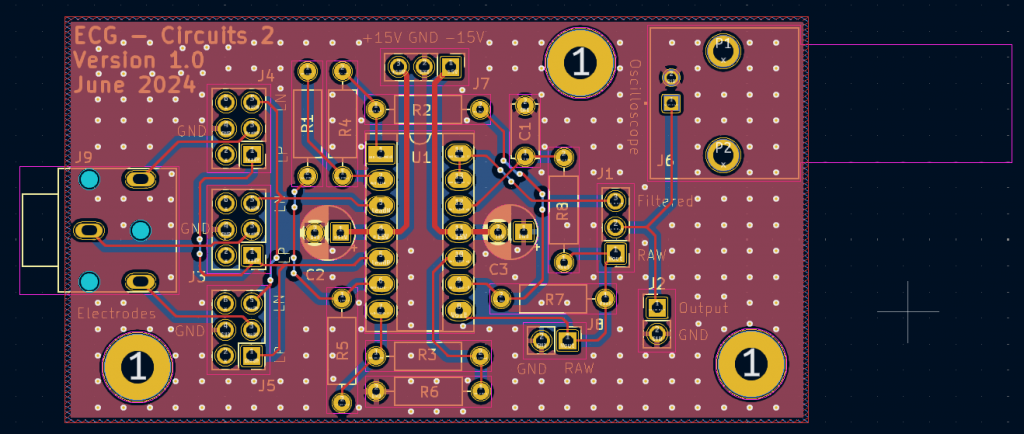
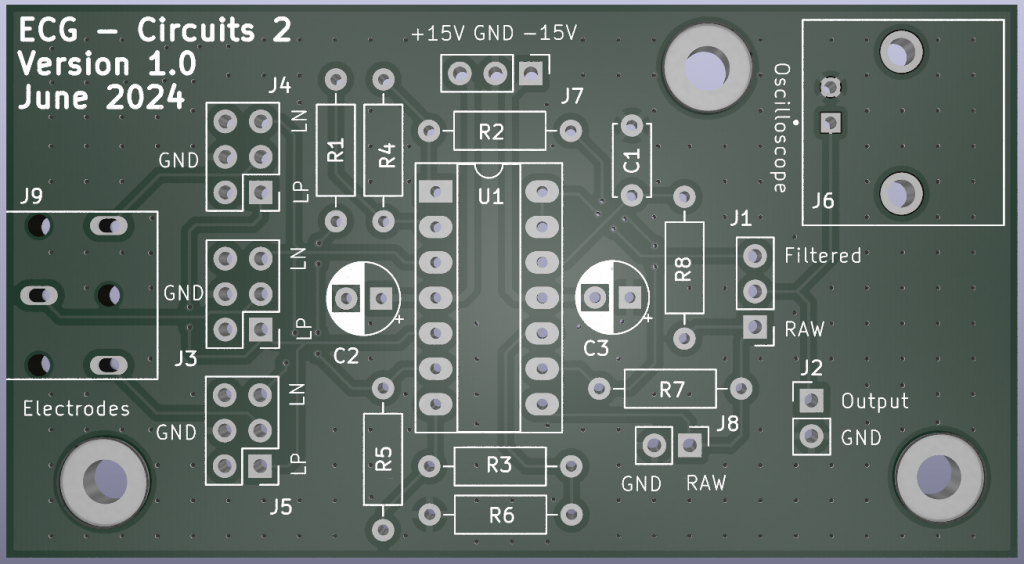
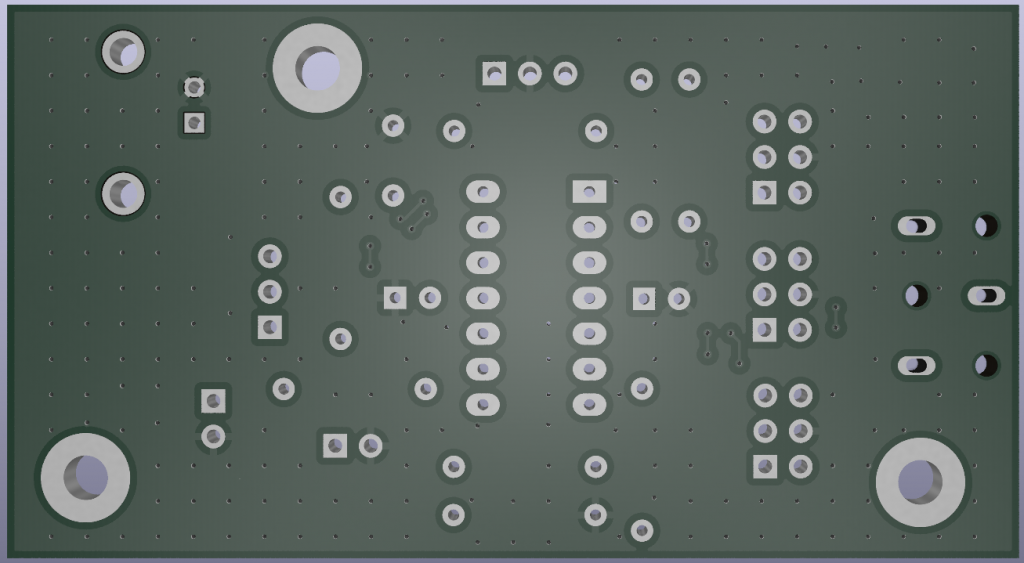
✔️ Phase C
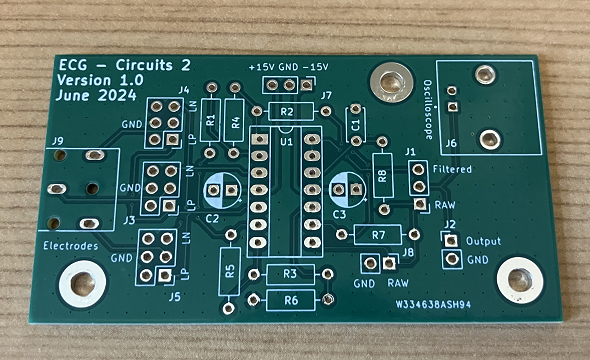
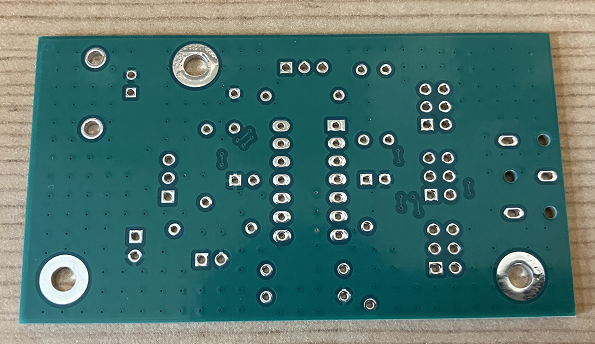
✔️ PCB Design
✔️ Assemble Stage
✔️ Testing Stage
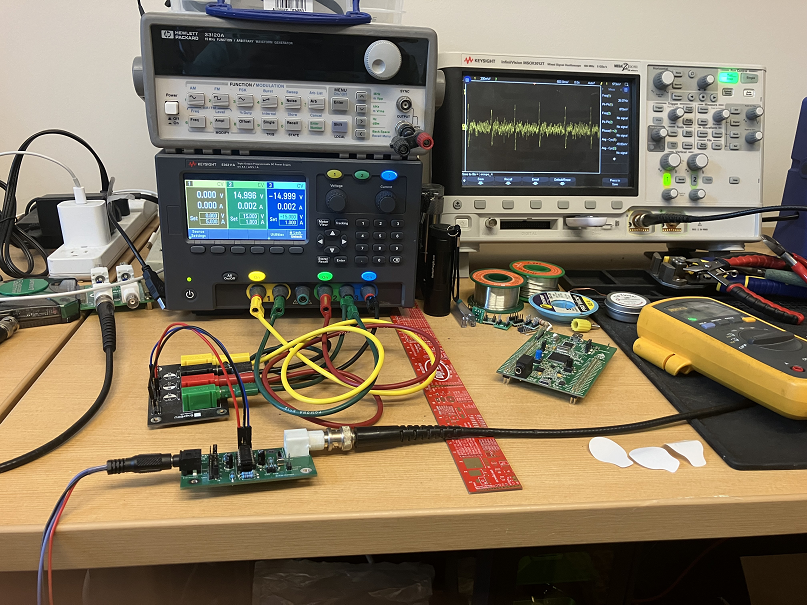
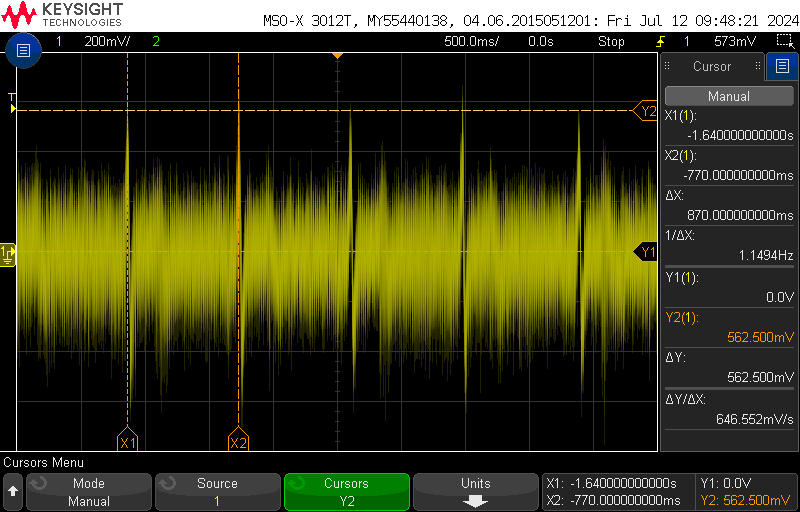
Unfiltered Output
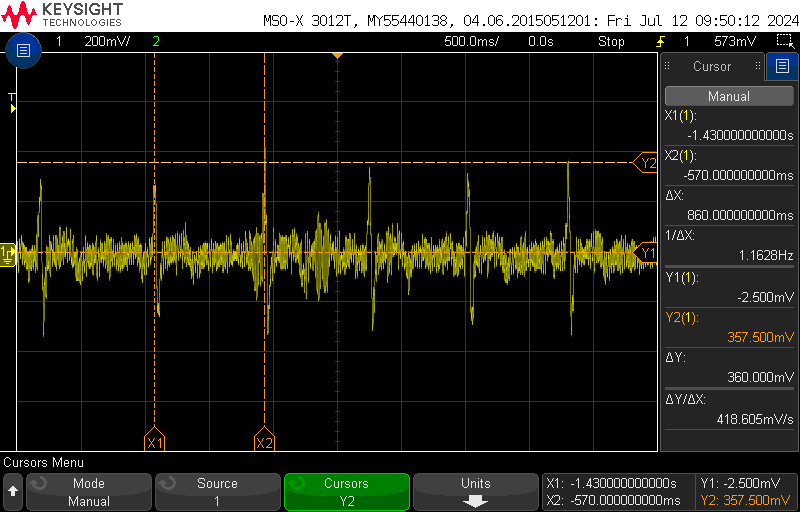
Filtered Output
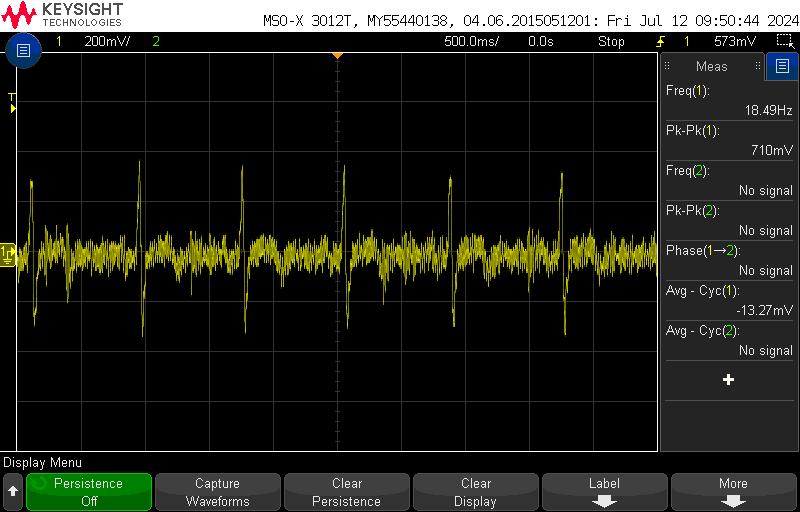
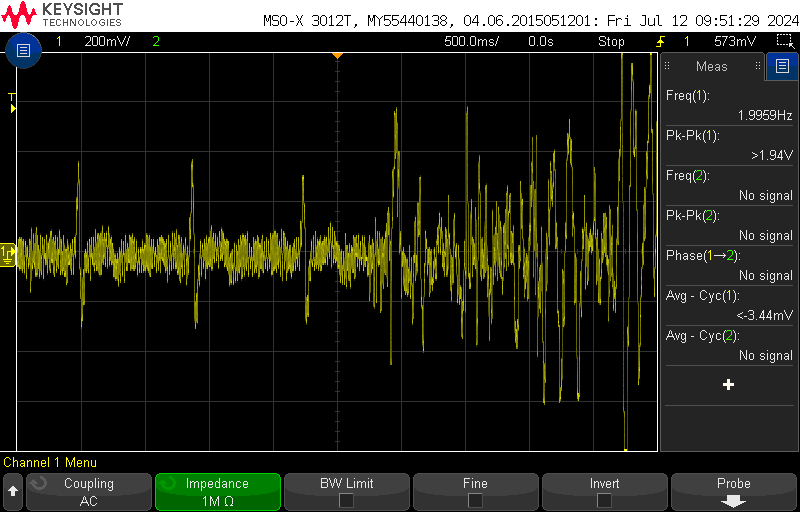
Muscle Movement
✔️ GitHub Repository
KiCad Files
✔️ References
Historical References
- [Ref 1] “The Lightning Tamers: True Stories of the Dreamers and Schemers Who Harnessed Electricity and Transformed Our World”, Kathy Joseph [Book]
ECG Knowledge
- [Ref 1] “Cardiac Muscle and Electrical Activity”, Nursing Hero Website [Article]
- [Ref 2] “The Cardiac Cycle”, Lumen Learning Website [Article]
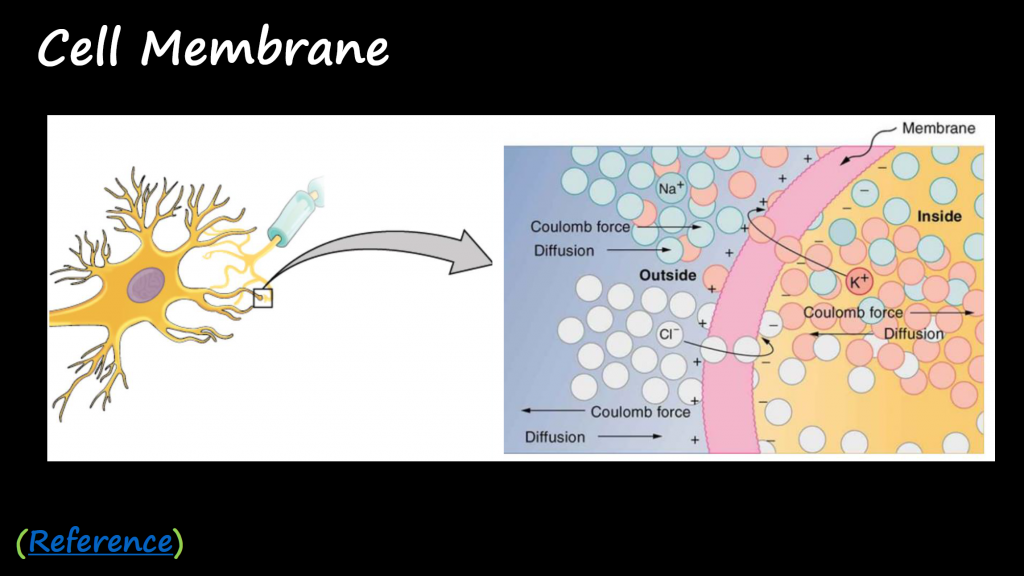
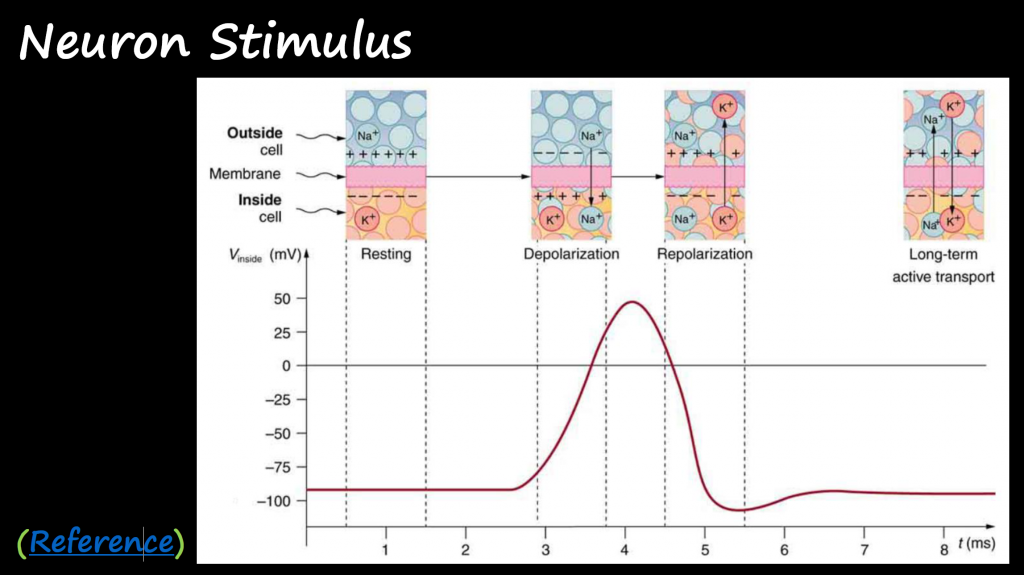
- [Ref 3] “Cells of the Nervous System”, Open Libraries Website [Article]
- [Ref 4] “Nerve Conduction-Electrocardiograms”, Lumen Learning Website [Article]
- [Ref 5] “EKG Interpretation & Heart Arrhythmias Cheat Sheet”, Nurseslabs Website [Article]
- [Ref 6] “A Guide to ECG Signal Filtering”, General Electrics Health Care Website [Article]
ECG Design References
- [Ref 1] “Build Your Own ECG-EKG Unit”, Ron Hoffman, nutsvolts Website [Article]
- [Ref 2] “DIT ECG Heart Monitor | Analog Interface + Arduino”, Christopher Martinez, hackster Website [Article + Video]
- [Ref 3] “Make Your Own Electrocardiogram”, JasonU14, instructables Website [Article]
- [Ref 4] “Sound Card ECG with AD8232”, Scott Harden [Article + Video]
- [Ref 5] “DIY ECG Machine On The Cheap”, Scott Harden [Article + Video]
- [Ref 6] “ENGR 40M Project 4: Electrocardiogram”, Stanford [Lab Project]
- [Ref 7] “ECG Signal Modeling in LTSpice”, larsen16, instructables Website [Article]
- [Ref 8] “Key Considerations for Designing ECG Front-End Circuit”, Texas Instruments Website [Video]
- [Ref 9] “Electrocardiogram (ECG) circuit for use with oscilloscopes”, Pico Technology Website [Article]
Additional References
- [Ref 1] “Twin-T Notch Filter Design Tool”, Okawa Electric Design Website [Article]
- [Ref 2] “Sallen-Key Low-Pass Filter Design Tool”, Okawa Electric Design Website [Article]
Sponsor

Happy 10th Anniversary PCBWay. Thank you as always for your support, I appreciate it 🙏